Business Insights Leveraging PowerBI- Automotive Seating Company

This case study demonstrates how a strategic implementation of business intelligence tools transformed data into actionable insights, addressing critical quality challenges for an Automotive Seating Company.

Solution Section

Problem Statement: Escalating COPQ and No Data Visibility

The client struggled with several quality-related issues across its global manufacturing and assembly lines:

Haversine Distance
Uncontrolled Cost of Poor Quality
Repeated quality lapses led to rising scrap, rework, and containment costs.
Google Maps API
Lack of Quality Visibility
Manual, spreadsheet-based tracking created blind spots, hiding trends and root causes.
AI Recommendation Engine
Budget Overruns
COPQ consistently exceeded planned thresholds, putting pressure on financials.
AI Recommendation Engine
Operational Inefficiencies
Widespread defects slowed production and delivery timelines.

Without a centralized COPQ dashboard in Power BI, quality improvement efforts remained reactive.

Solution Section

Solution: Power BI Dashboards for Manufacturing Quality

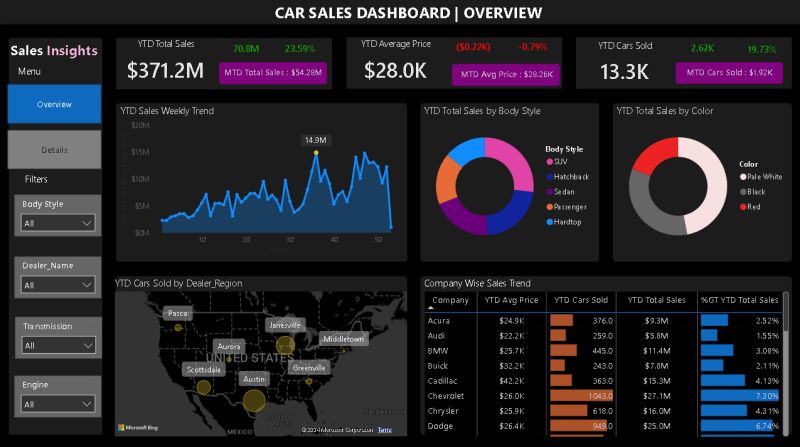
To overcome the limitations, JBS deployed a custom Power BI solution for manufacturing root cause analysis focused on COPQ reduction and process optimization.

Haversine Distance
Data Integration
Integrated ERP, MES, quality control, and feedback systems into a unified data model.
Google Maps API
COPQ Dashboard in Power BI
Built a visual analytics dashboard that segmented COPQ by plant, part, error code, and department.
AI Recommendation Engine
Root Cause Quality Analysis BI
Enabled drill-down views for investigating root causes of top defects.
AI Recommendation Engine
Self-Service BI & Automation
Empowered QA managers to access reports directly and automate daily/weekly insights.

Without a centralized COPQ dashboard in Power BI, quality improvement efforts remained reactive.

Solution Section

Features of the Power BI COPQ Dashboard

Real-time KPIs on scrap rate, rework volume, and customer containment
Error classification by plant, assembly line, and defect type
Heatmaps for identifying high-risk zones
Historical comparison vs. forecasted COPQ trends
Alerting system for budget deviation thresholds
Solution Section

Business Outcomes: Quantified Improvements

$5M+ Annual Savings: Reduction in COPQ from proactive root cause mitigation
25% Faster Decision-Making: Instant access to quality data for rapid executive response
30% Decrease in Containment & Rework: Data-driven workflows and error prevention
12% Boost in Customer Satisfaction: Quality improvements led to measurable perception gains
Improved Competitiveness: Reduced costs allowed for more competitive pricing and market expansion
Technology Stack

Technology Stack

Microsoft PowerBI
SQL Server
Azure Data Lake
Azure Data Factory
Copyright © Jade Business Solutions LLC.